Your SCADA shows you data.
Insights shows you money and failures.
It reads what your plant already exposes — PLC tags, drive speeds, temperatures, flows, pressures, counts — over open Modbus. No new hardware required. Then it tells you what's about to break, what everything actually costs, and where production is leaking.
Running today · taking demo requests
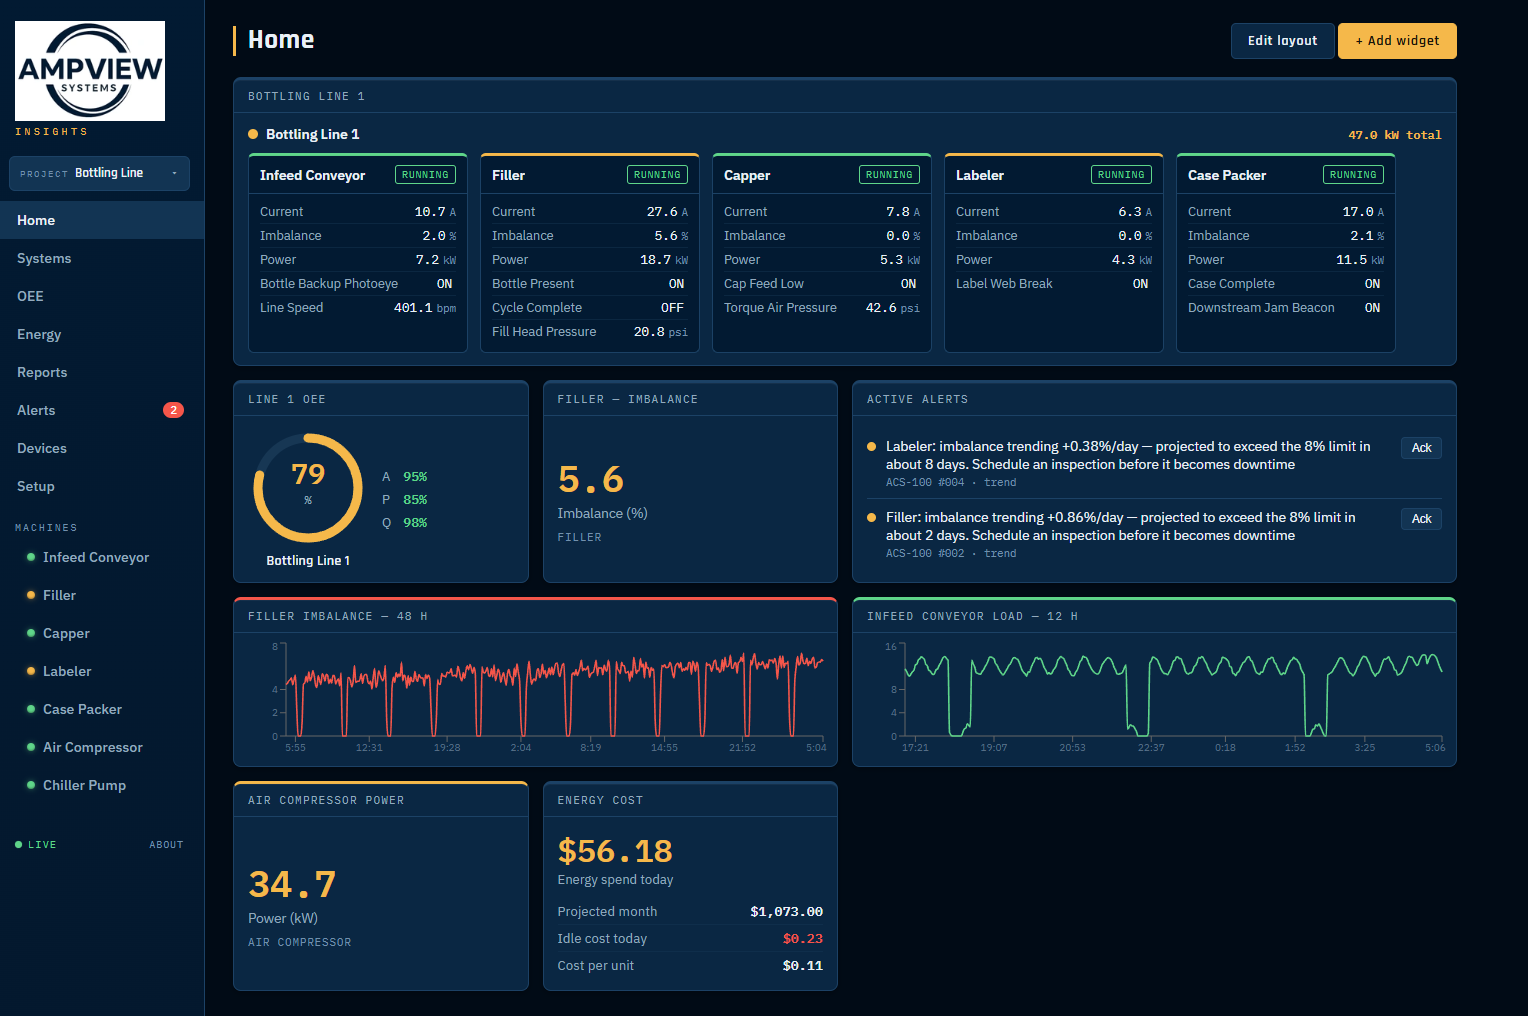
Home — a dashboard the customer builds themselves
Any point in your plant, not just ours
Insights is a data platform first. Point it at a VFD, a power meter, a PLC gateway, or a panel you built fifteen years ago — name the register, give it a unit and a scale, and it becomes a first-class tag: trended, alarmed, costed, and reportable exactly like everything else. Most sites start with equipment they already own.
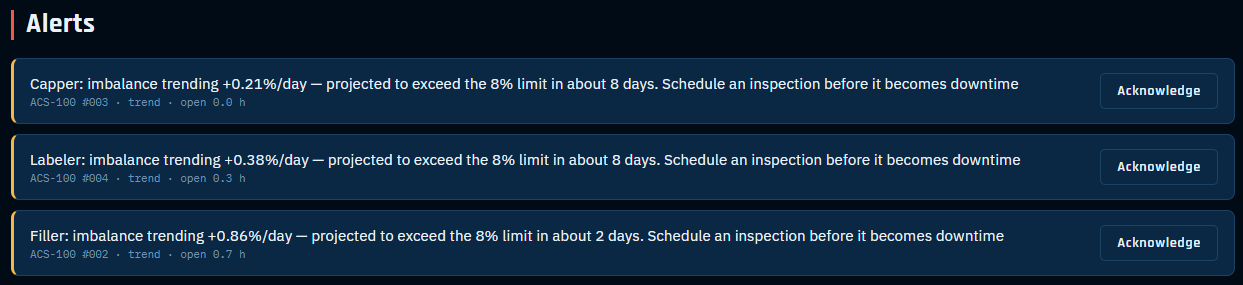
It tells you a motor is failing. In English.
Insights watches all three phases continuously and fits the trend. When a motor starts drifting toward failure, it doesn't hand you a spectrum plot to interpret — it writes the conclusion, with a timeline.
click to view full size
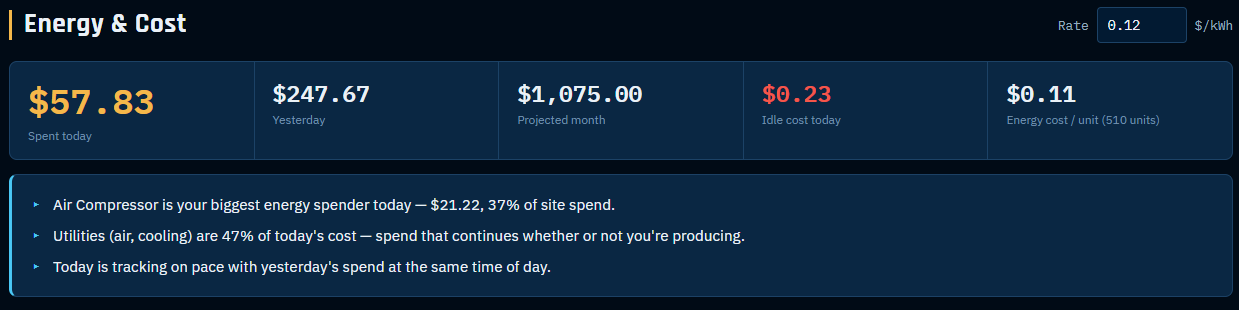
What one good part actually costs you.
Energy, labor, material, overhead, and a fair share of the plant's air and cooling — divided by the units that actually shipped. Most plants have never seen this number for a single line, let alone watched it move in real time.
click to view full size
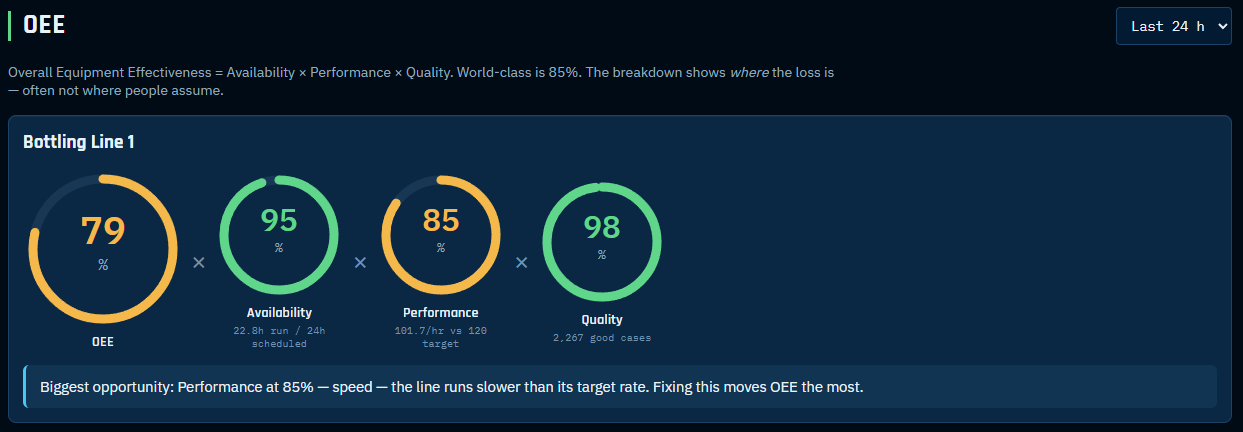
OEE that says where the loss is.
Availability, performance, and quality from the same current data — no extra sensors, no operator data entry. And it names the factor dragging the number down, because knowing you're at 79% doesn't tell you what to fix.
click to view full size
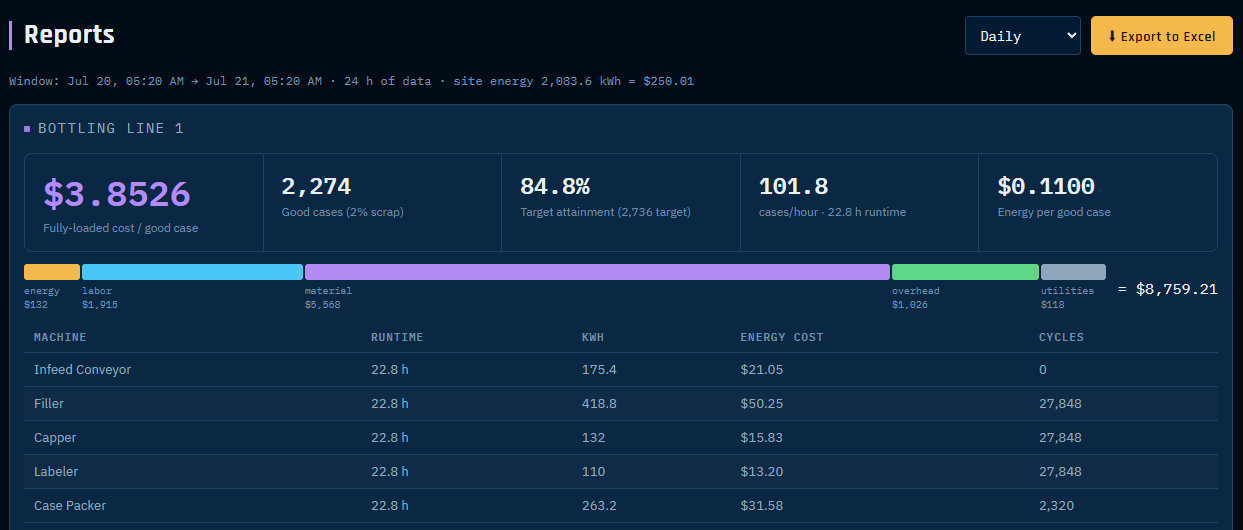
It leaves the app as a spreadsheet.
Daily, weekly, monthly, quarterly. Good units after scrap, target attainment, runtime and energy by machine, and the full cost stack broken out — energy, labor, material, overhead, utilities. One button exports all of it to Excel.
Because the person who signs off on your line doesn't live in a dashboard. They live in a spreadsheet, and they want the math shown.
click to view full size
Built the way plants actually want to buy
The monitoring platforms in this space are cloud-only, priced per machine forever, and quoted behind a sales call. We went the other way on purpose.
See it running on your line
Tell me about one line in your plant — the machines and roughly what they do — and I'll model it in Insights and walk you through it. Not a slide deck: your equipment, your numbers, your cost per part.
✓ Thanks — that came through. I'll be in touch shortly.
Goes straight to me, not a sales queue. Usually a same-day reply.
Built by AmpView Systems — controls and automation, Rockford IL.
Screens above show the working product on a simulated plant. Your demo runs on a model of
your line. Pairs with the ACS-100 clamp-on monitor, now in pilot.